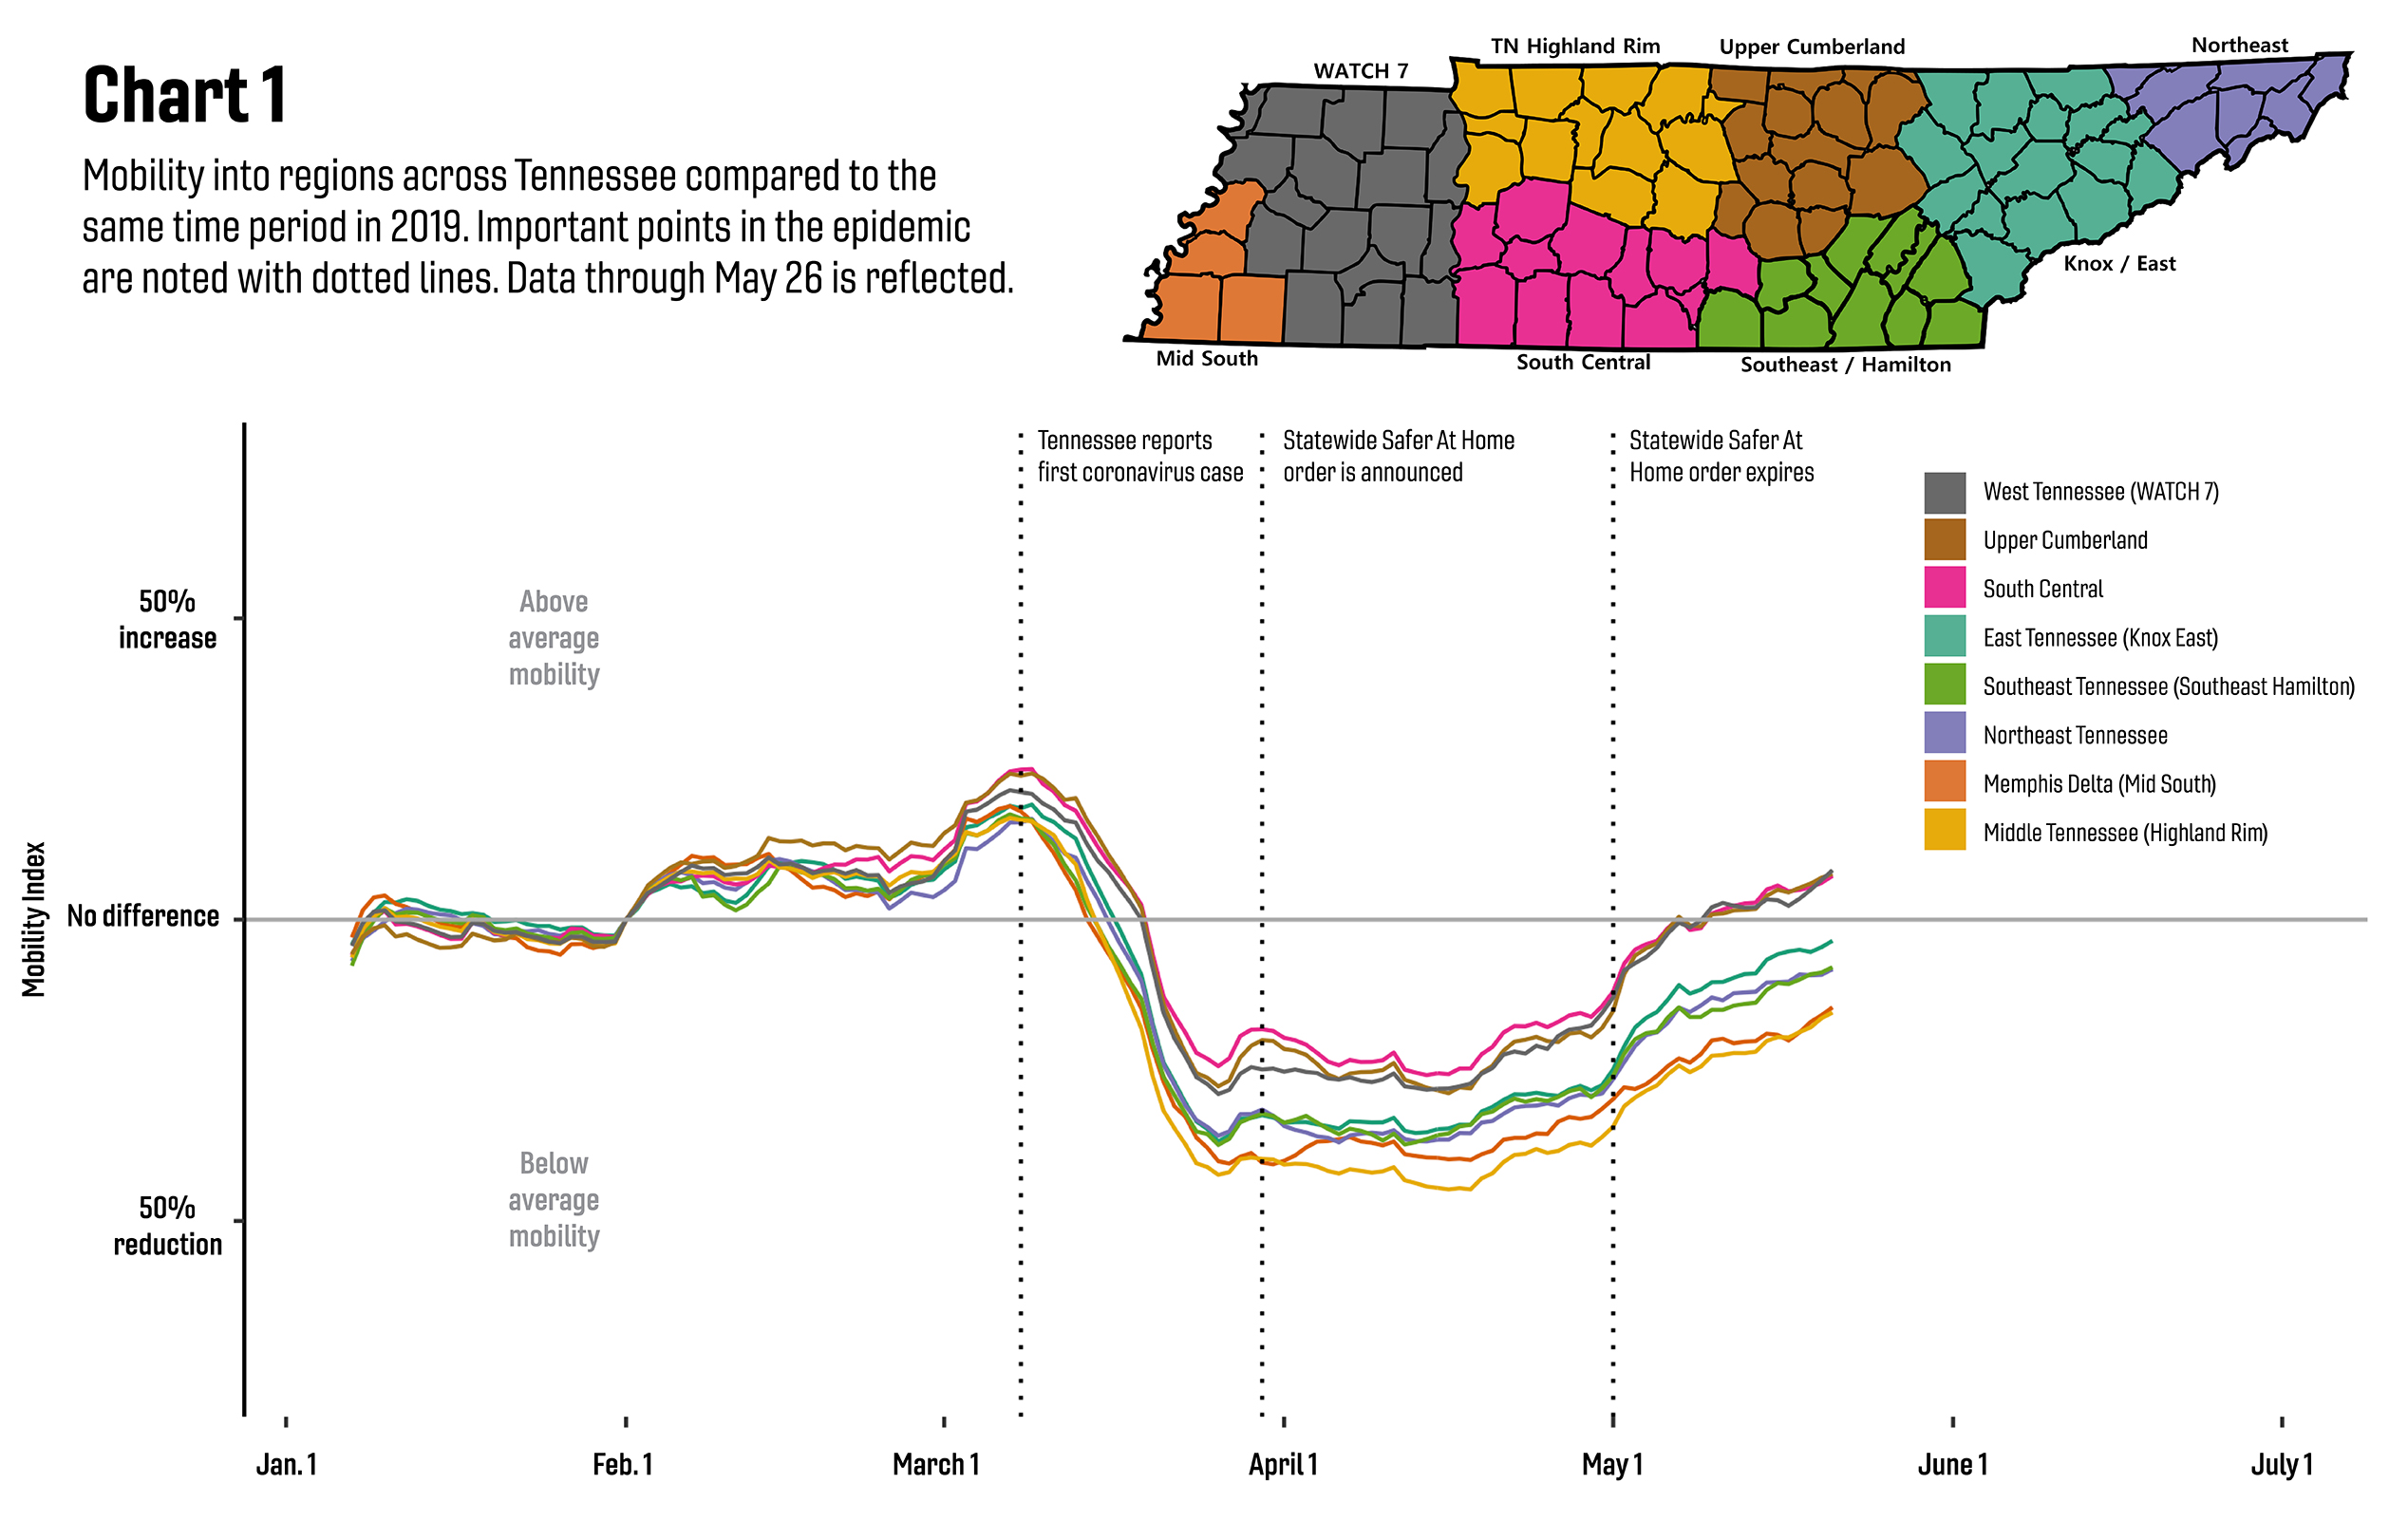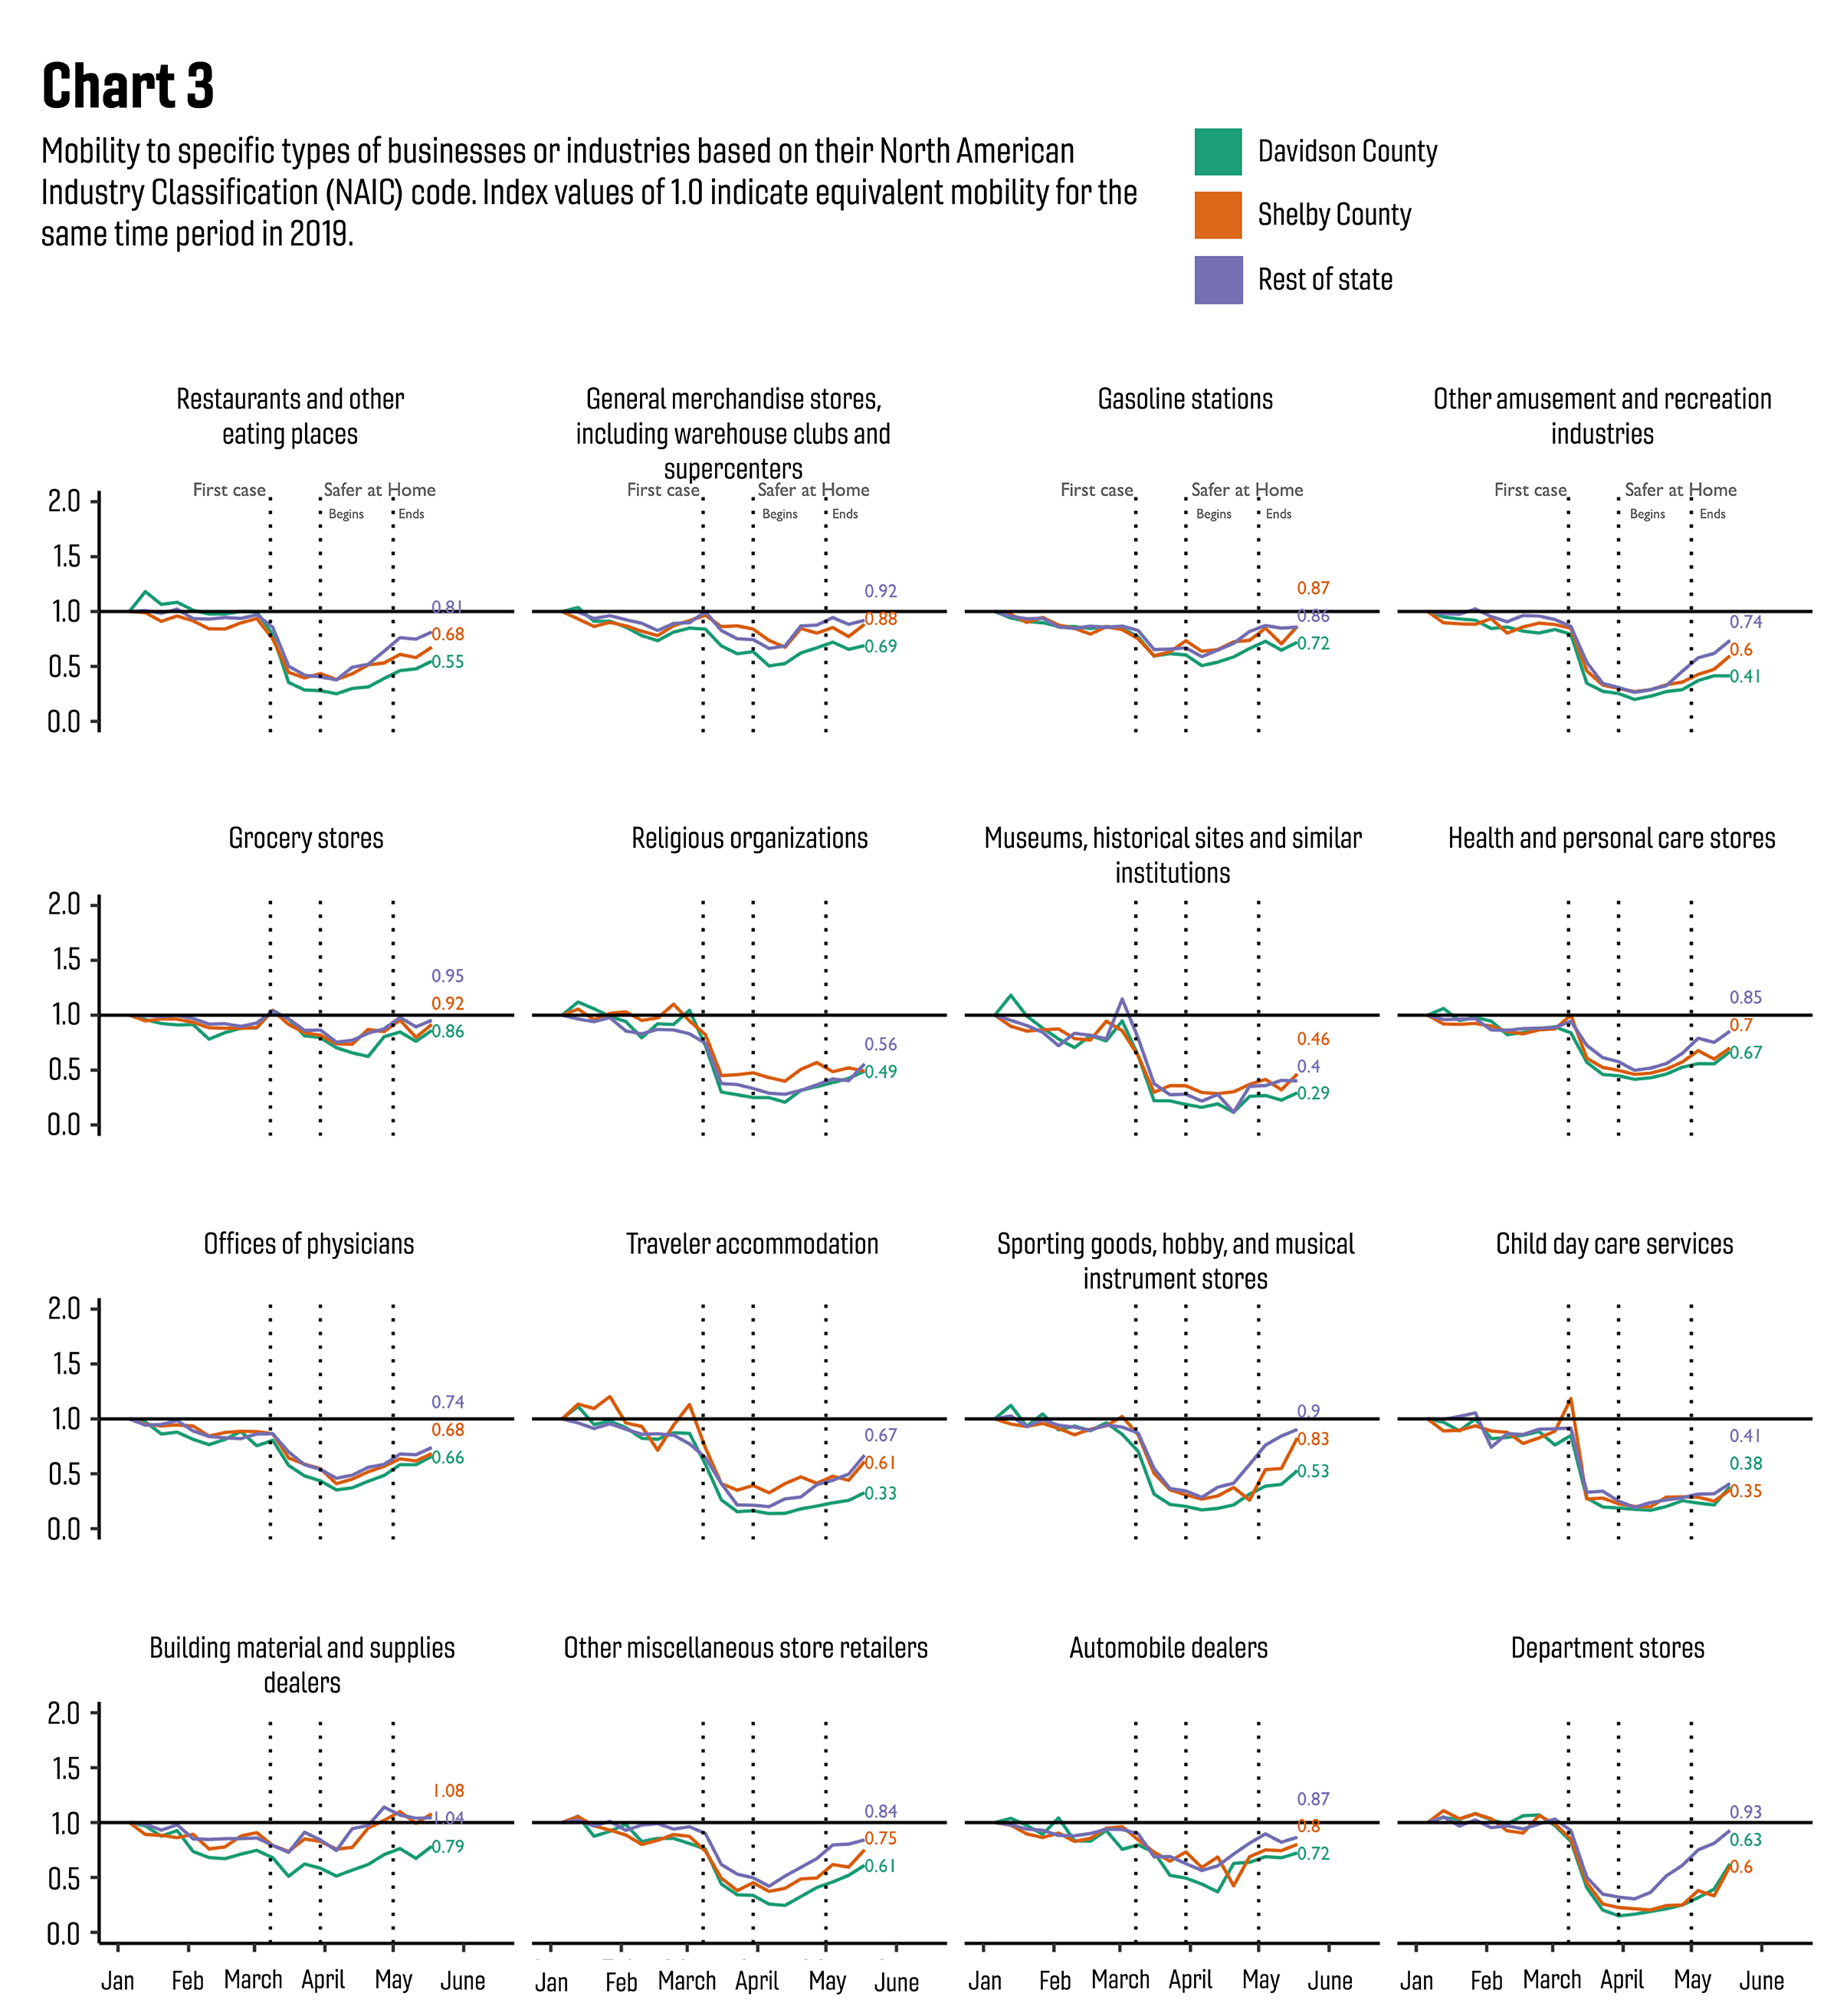
Tennesseans dramatically reduced travel outside of their neighborhoods just after the first cases of COVID-19 were reported in Tennessee in early March. Economic mobility declined in all regions of the state at least a week before the governor’s statewide Safer at Home order was announced in late March—and only areas of the state that have been least affected by the virus have returned to mobility levels consistent with the same period in 2019 since the order expired at the beginning of May.
The analysis is the latest from faculty researchers in the Department of Health Policy at Vanderbilt University School of Medicine and Vanderbilt University Medical Center, and uses anonymized cellular device data to analyze how Tennesseans have moved around the state and to specific types of businesses and industries, like restaurants, retail stores, doctor’s offices and churches.
“What many people want to understand is how the scope and profile of economic activity has changed with the coronavirus, and if this activity has any relationship with continued transmission of the virus,” said John Graves, associate professor of Health Policy and director of the Center for Health Economic Modeling at Vanderbilt. “These are difficult questions to answer definitively, but our analysis provides the most detailed look to date on how the economic landscape continues to shift.”
One of the main takeaways from this new data analysis, Graves said, is that Tennesseans were quick to reduce their movement just as the epidemic was detected in Tennessee, well before the statewide Safer At Home order was even announced. This behavior mirrors the modeling team’s earlier analyses showing that Tennesseans “slammed the brakes” early on and successfully reduced transmission of the virus in many areas of the state.
The analysis shows that areas of the state with higher numbers of COVID-19 cases have reduced their mobility more than areas with fewer cases and have been slower to return to normal mobility than the less-affected areas. Before coronavirus was detected in Tennessee, mobility in the most vs. least affected areas was virtually identical.
Since mid-April, all areas of the state have seen increased mobility—and some non-metro areas have seen further increases since the Safer at Home order expired on May 1. Even without severe restrictions on business operation, travel to restaurants remains well below the levels usually seen in mid-May, and travel to churches and other religious organizations remains 50-60% lower than usual. Memphis and Nashville, areas with more cases and local reopening plans, have lower mobility in almost every major industry compared to the rest of the state.
The Vanderbilt researchers are part of a data sharing coalition spearheaded by SafeGraph, a data analytics firm. SafeGraph sifts through cellular device data on over 40 million devices nationwide, and aggregates privacy-protected mobility data across geographic areas containing between 600 and 3,000 people. Cellular devices are assigned a “home” based on their most common location at night, and SafeGraph anchors movements from these home locations to track movements to other geographic areas and to places throughout the state.
“Our recommendation is for Tennesseans of every stripe to focus on reducing the spread of the virus. Our analysis underscores that as long as the virus is spreading, it only increases the risk of economic contagion the virus has brought along with it,” Graves said.
